


Does the TGA refill even matter?
short term liquidity down, long term liquidity up

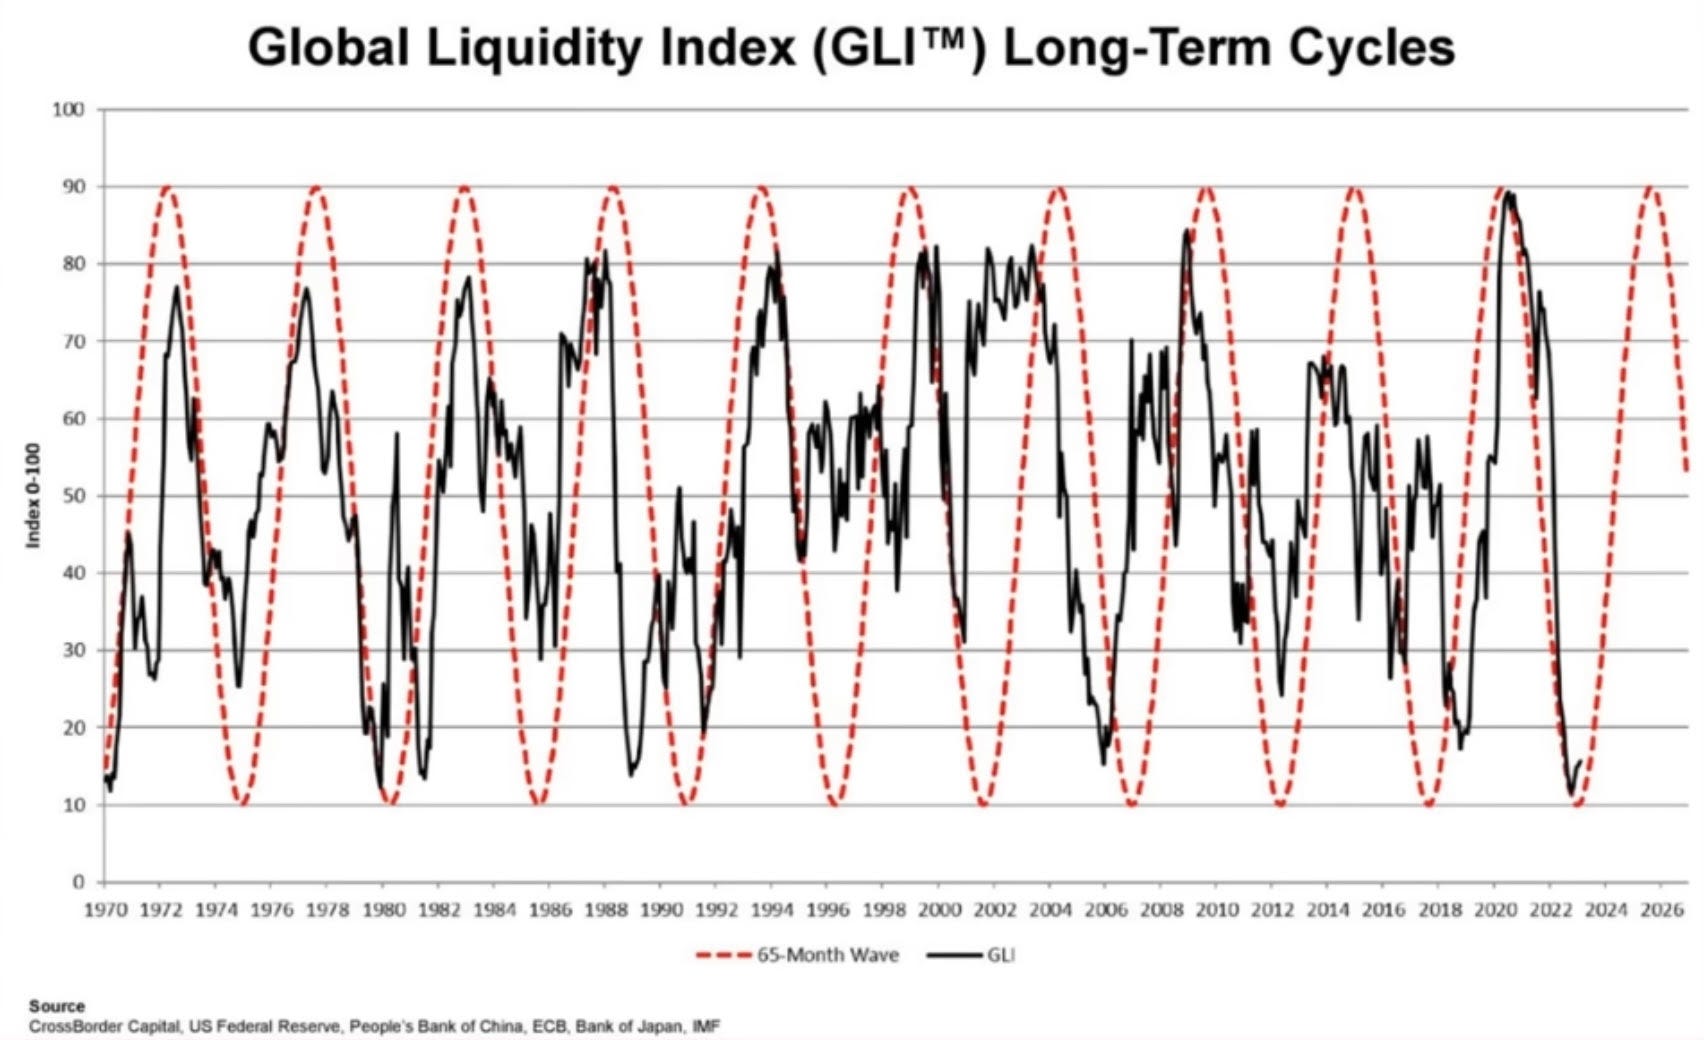
While there is a projected decrease in the short term, our analysis points toward a rising trend for net liquidity through 2026. This pattern is consistent with the established 60-70 month cycles in macro liquidity. The bottom of this cycle was the UK Gilt crisis in October 2022 — the “Treasury Pivot.”
Take a look at the updated chart of liquidity in blue, compared to SPX, in orange:

The vertical green lines mark the recent liquidity injections. The first green line marks the macro bottom: the “Treasury Pivot.” The second green line marks the BTFP, which was the liquidity response to the first part of the the banking drama. The second part may occur this fall, which could also result in the next liquidity injection.
While liquidity is currently heading downward as a result of the TGA refill, the next liquidity injection is inevitable (otherwise there is a risk of financial or fiscal instability).
We are moving out of the bottoming phase of the 65-month macro liquidity cycle:
This year’s rally may be the market’s way of acknowledging this shift. The strength of the rally, led by sectors like housing and semiconductors, indicates a bull market. As such, any short-term dips—caused by the TGA refill or a banking drama—could offer opportunities to increase positions.
Of course, it could evolve into something more than just a dip. Druckenmiller still expects a hard landing, but remains committed to his long NVDA position, expecting to hold it for several years. According to him, the "fat pitch" is still around 8-24 months away, an estimate that aligns with the timing of the liquidity cycle as we've outlined above. It’s a bull market, you know!
Hawking Research does not provide investment advice.